NASA and IBM launch an open AI to better map the Moon
NASA and IBM publish an open AI to map craters and spot potential ice on the Moon. These are his abilities and limitations.
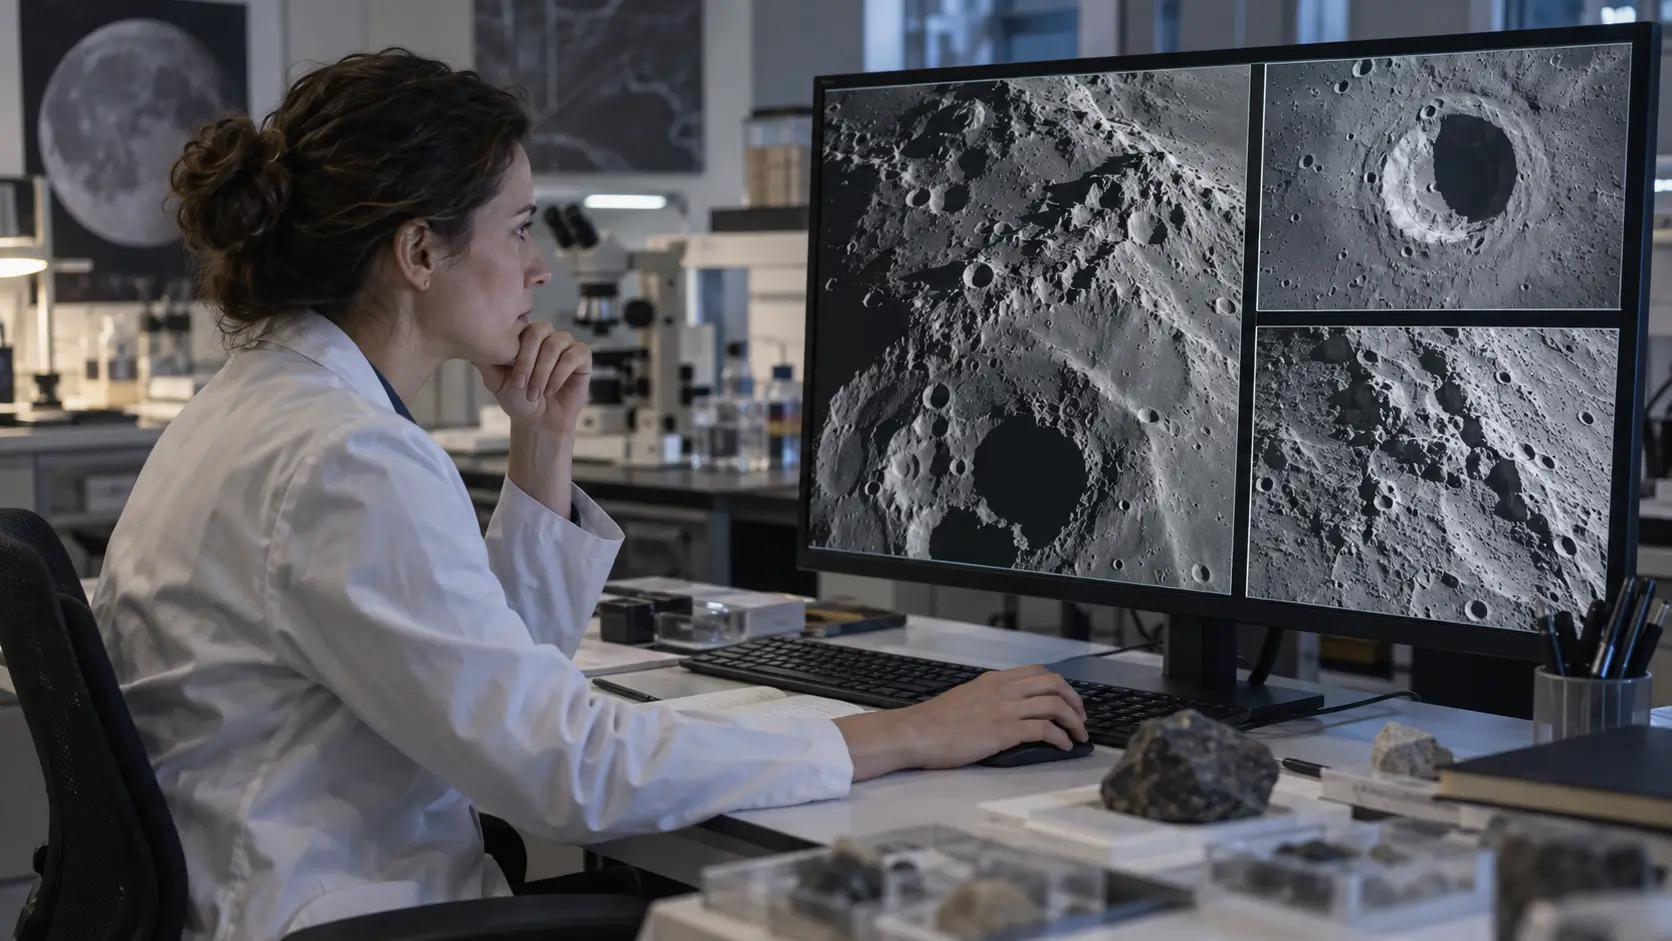
Lunar missions have accumulated petabytes of images, thermal measurements, topographic maps and radar data. However, their diversity makes comparisons difficult: instruments do not observe the same phenomena or with the same resolution.
NASA and IBM published a model of artificial intelligence on September 10, 2026, to gather these observations in a common representation.
NASA-IBM Lunar Foundation Model can be adapted to map craters, study volcanic formations and identify areas where ice appears more likely. However, it does not measure this ice directly and cannot certify the safety of a landing site.
An AI that doesn't converse
The model is not a conversational robot comparable to ChatGPT. It analyses images and scientific data associated with portions of the lunar surface.
Its Vision Transformer architecture has been trained on about two million sets of geographically aligned observations. Each set can bring together visible or ultraviolet images, topography, ground inclination, temperature, radar reflectivity and certain mineralogic indices.
According to the [presentation of IBM Research] (https://research.ibm.com/blog/nasa-ibm-lunar-foundation-model), the collection harmonizes more than 30 layers from nine instruments distributed between four American and Japanese missions, including Lunar Reconnaissance Orbiter, GRAIL and SELENE/Kaguya.
The resolutions are very different. Some images represent about one metre per pixel, while others cover approximately 100 metres per pixel. The model learns to work with these two scales without pretending to invent the missing details of an instrument.
Find regions that deserve a review
NASA would first like to use the model for three categories of work: detecting small uncategorized craters, delimiting certain volcanic formations and assessing the ice potential of polar regions.
Lunar ice could eventually provide water, oxygen and certain elements necessary for fuel production. It is potentially found in craters that almost never receive sunlight.
These areas are difficult to study. The visible images reveal little detail, while thermal, radar and topographic data each have their own limitations.
The model can combine slope, terrain orientation, maximum temperature, and theoretical ice stability depth to produce a potential map.
This map is a prediction based on several observations and models. It does not prove that an exploitable amount of ice is under the ground. Only an on-site instrument, appropriate radar or sampling could confirm this.
Gains that vary by task
IBM states that the model reduced the ice potential assessment error by 22% compared to a SwinV2 visual model as a reference.
For the detection of craters at a resolution of about 100 meters per pixel, it would have surpassed this model by almost 19% while using twice as much drive data.
At a scale of one metre per pixel, however, its result was essentially equivalent to that of SwinV2. The improvement achieved for volcanic formations was only about 3%, with a margin sufficiently low to impose caution.
Detailed results are published in the [model technical sheet] (https://huggingface.co/nasa-ibm-ai4science/NASA-IBM-Lunar-Foundation-Model). They still come from the team that designed the system and will have to be replicated by independent researchers.
The Next Web stresses that the unified dataset could become as important as the model itself, since the lunar archives were previously divided into several formats and resolutions.
A truly open but demanding model
The model, adaptation code and SomBench data sets are published on Hugging Face under an Apache 2.0 license.
Researchers can adapt to a specific task by complete training or using a light method called LoRA. The latter only modifies a small part of the parameters instead of retraining the entire system.
The creation of the model still required 16 NVIDIA H100 accelerators for approximately 1,100 hours of cumulative calculation. A user does not need to repeat this initial training, but adaptation remains more complex than installing a conventional application.
No ready-to-use inference services are offered directly on the template page. Download files, prepare data and use specialized tools like TerraTorch.
Prices and availability in Canada
The download does not include a licence fee and there are no geographical restrictions on Canada.
However, exploitation is not necessarily free. Costs will vary depending on storage, equipment, cloud services, number of tests, amount of data and scientific staff required.
It is not a consumer product or an official Canadian service. A Canadian university or company may review the model, but no integration into a Canadian Space Agency mission has been announced.
Limits or Considerations
The data sheet specifies that the model does not have an absolute geodetic reference. Some generated coordinates can be shifted by several tens of degrees.
Its general outputs are not calibrated measures. They do not replace instruments, photogrammetry or geodetic solutions used for navigation.
The model was not validated to permit a landing, track or other operational security decision.
Very high resolution data do not cover the entire moon uniformly. A result obtained in a well-observed region may therefore not reproduce elsewhere.
Conclusion
NASA and IBM's lunar model does not automatically discover a water supply or a safe location for a base.
Its usefulness is more realistic: collecting incompatible observations, identifying reasons and helping scientists determine which regions deserve further analysis.
Its open publication will now allow independent teams to verify its results, discover its weaknesses and adapt it to new issues. It is this validation, much more than the percentages announced at the launch, that will determine its true scientific value.